RTMC graph
Hi all,
is it normal my graph in RTMC Pro shows the data 10 min after the start of the selection.
Example: when select in report range 09:00-12:00 it shows 09:10-12:00 in the graph...
in view pro its function normally.
Check your Axis properties - specifically the bottomo. Do you have an offset specified? Is the Display Range the same as the Data Range?
yeah i already checked all those settings, might something wrong with rtmc pro itself...?
* Last updated by: Mavada on 11/14/2012 @ 1:06 PM *
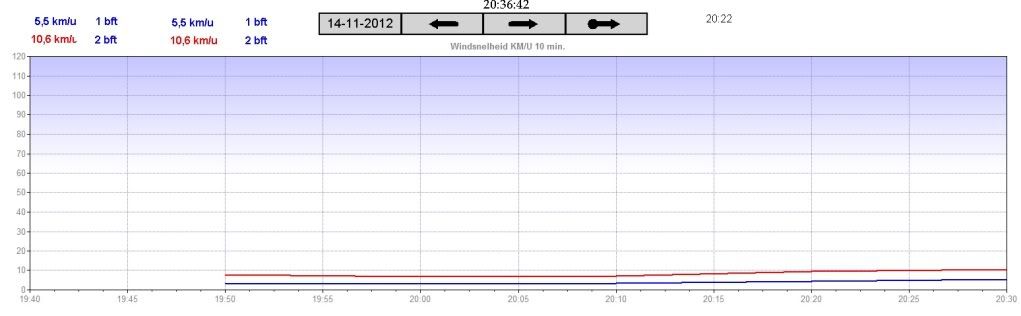
when i enter a start time before record 0, lets say 19:30, it shows indeed the 19:40 (=record 0) value in the graph...
im out of options right now, very strange and frustrating...:(
It's like you have a 10 minute offset set on the bottom axis. That's weird.
no i havent, thats strange isnt it?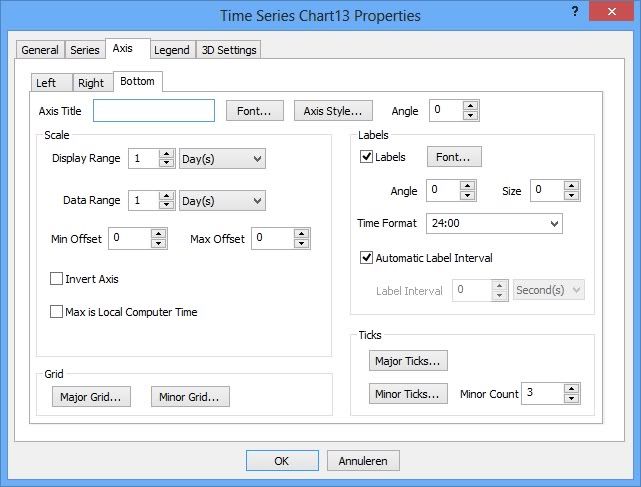
could it have to do with the time being adjusted some weeks ago, from summer to wintertime? ive adjusted the clock one hour back from normal...could this have caused the data from lets say 19:40 has moved to before that timestamp? So 19:40 means data from 19:30?
if so, how can i solve it?
still in trouble, anybody got an idea/solution?
It is because the report intervals are open-closed. So, if you show a 3-hour chart with hourly data, would you expect to see 3 points or 4 points? On an open-closed interval, you would only see 3 points, one for each hour. If it was a closed-closed interval, there would be 4 points, but the first point would actually represent data outside the 3 hour interval. We made a design decision to use open-closed intervals, and it results in what you are seeing.
ok so view pro is using an closed closed interval?
are they really behaving different, rtmc pro: open-closed, view pro: closed-closed?