Average witn report range
ive got an average value of 10 min. in my 1 hour 1 sec graphs in rtmc and a report range function of an hour, but...when the graphs start all over at the end of the hour, the average value doesnt show anything the first 10 min. cos theres not enough data yet to fill from 0-10 min...is there a solution the have to 10 min. average data shown no matter where the graphs are...so a continious working 10 min. value?
* Last updated by: Mavada on 7/13/2012 @ 1:47 PM *
Use the StartRelativeToNewest function as a prefix to your averaging expression to specify how far back you want to go in the data when you first start the project.
Do you mean in RTMC Pro or in CRBasic?
RTMC. Take a look at the RTMC Help. Search for "expressions" or locate "expressions" in the Help index. Click on it and you'll see all the functions available in RTMC. The StartRelativeToNewest function is toward the bottom in the "Start Option Functions" section.
Yes ive found that, but its a bit above my knowledge about instructions etc...:(
this is my data in which the instruction should be...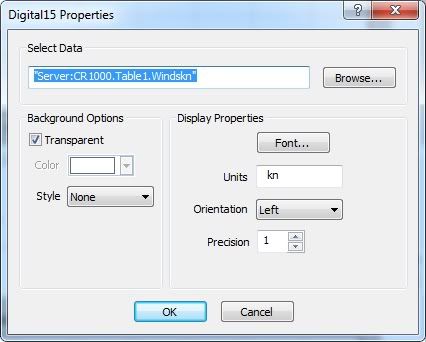
ive used this one but that didnt work...
StartRelativeToNewest(10*nSecPerMin,OrderCollected);MaxRunOverTime("Server:CR1000.Table1.Windskn",1)
any ideas?
any solutions?
* Last updated by: Mavada on 7/19/2012 @ 1:15 PM *
this doesnt work either...
StartRelativeToNewest (10* nsecPerMin, OrderOption )("Server:CR1000.Table1.Windskn")
Table 1 is a 10 min. table..
* Last updated by: Mavada on 7/19/2012 @ 1:33 PM *
this one neither...
StartRelativeToNewest(20* nsecPerMin, OrderCollected);AvgRun("Server:CR1000.Table1.Windskn",10)